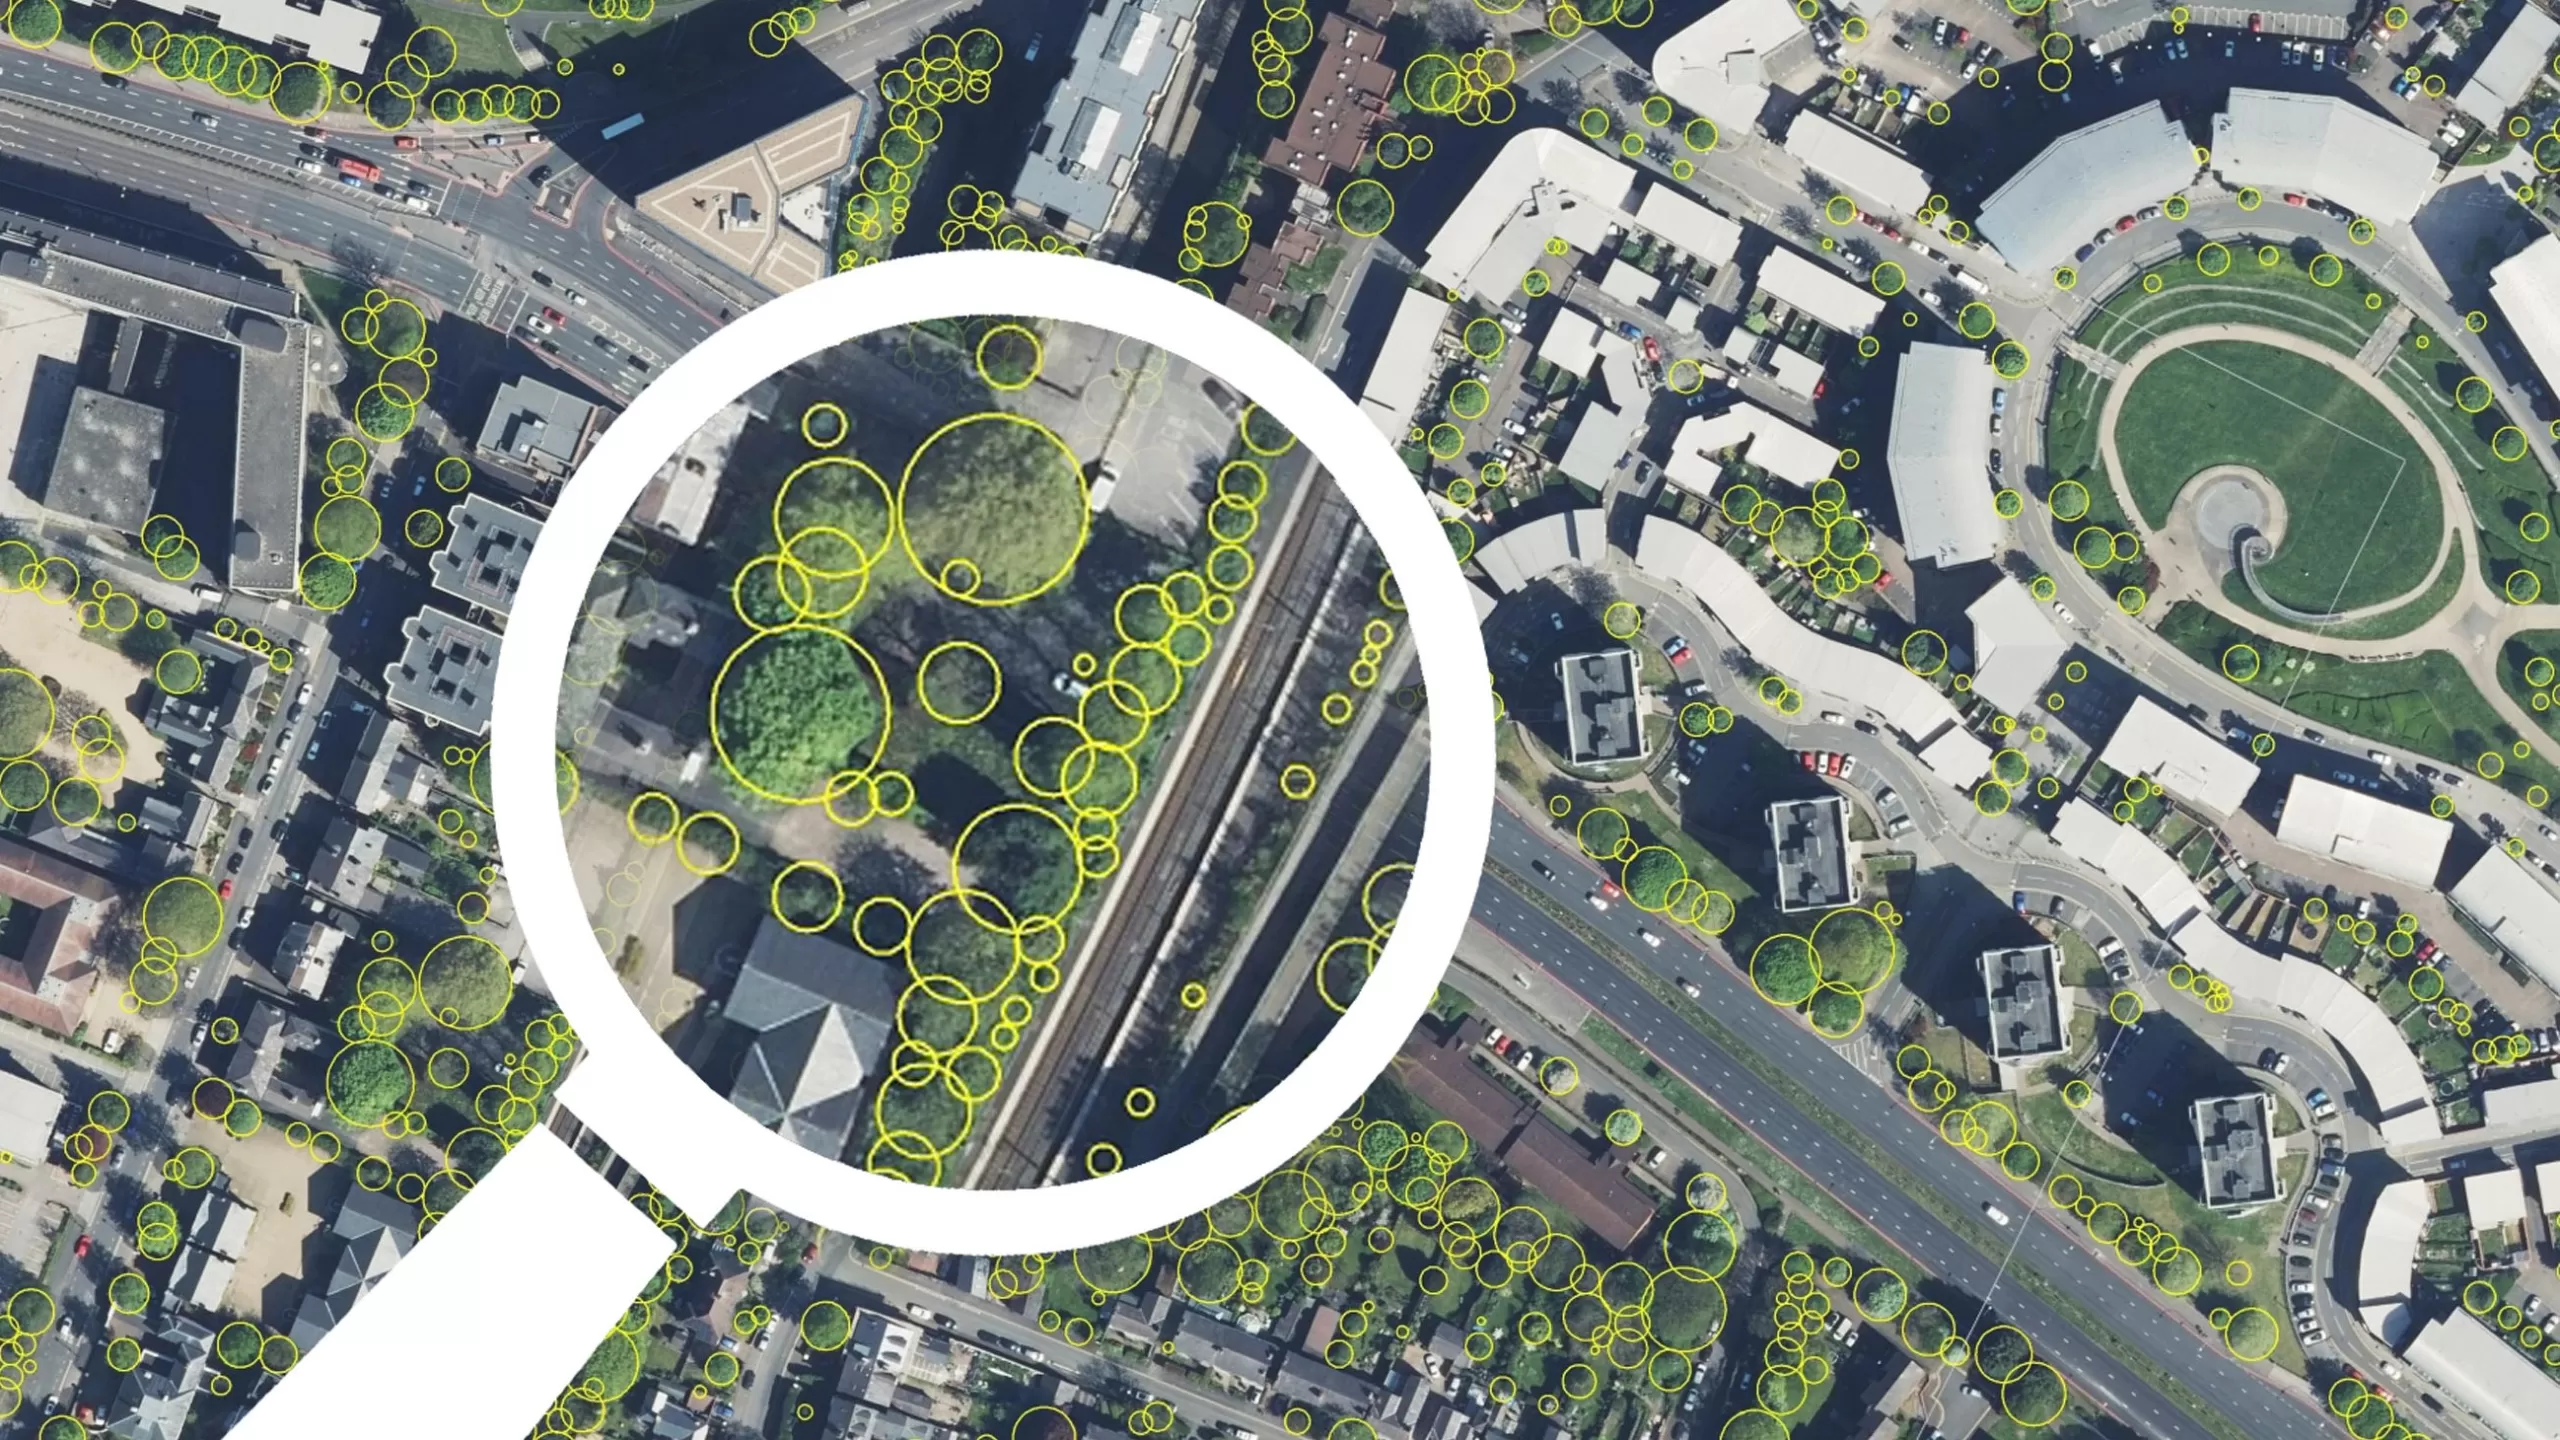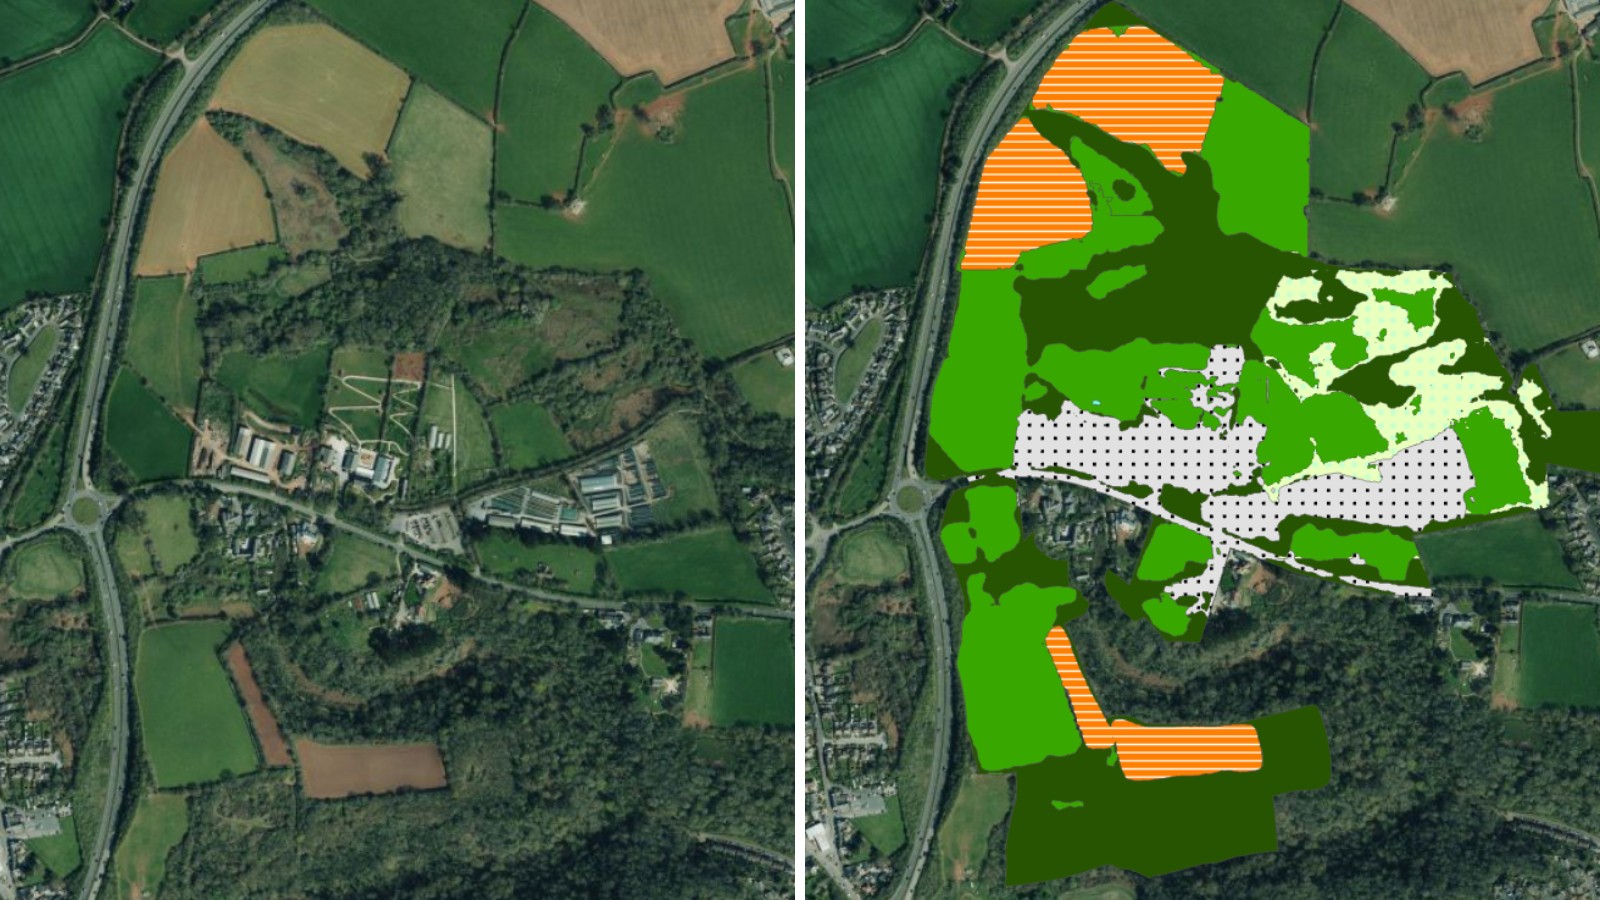
Birmingham City Council has launched a first of its kind mapping portal to address the issue of tree equity across the city. With National Tree Map data, created by aerial mapping company Bluesky International, at its core, the interactive tool allows users to identify which parts of the city have lower than average tree canopy cover and investigate possible relationships between canopy cover and other socio-economic and environmental factors. The online platform also enables users to model different scenarios and targets to identify planting opportunities and locations to increase the number of trees.
“Birmingham is already leading the way both in terms of green spaces and trees, with an average 20% canopy cover compared to a UK average of just 13%,” commented Simon Needle, Principle Arboriculturist at Birmingham City Council. “However, this doesn’t reflect the diversity within the city, with some areas as low as 7% canopy cover whilst other areas are hitting close to 60%.
“In order to achieve equity in canopy cover across the entire city we need to first identify where the inequalities are and assess relationships between canopy cover and other factors such as population density, deprivation, climate change and pollution. We also need to understand how different targets and policies to increase canopy cover might unfold, allowing detailed plans to ensure the right trees are planted at the right time and in the right place.
“The Bluesky data is fundamental to this work as it gives us the intelligence we need to benchmark our starting point,” he continued. “Using the National Tree Map, we can also analyse the impact and influence of factors that have already contributed, and continue to contribute, to low canopy cover. We can model different canopy cover growth plans and planting programmes, enabling us to measure and report on key performance indicators.”
The online mapping portal, created by Birmingham City Council and its partners, allows users to easily visualise current canopy cover, colour coded by electoral ward. Interactive tools highlight wards with the lowest and highest levels, in addition to being able to select wards by their potential planting area percentages.
A set of planning tools uses canopy cover percentages, calculated using the Bluesky data, for each of the 639 Lower Super Output Areas (LSOA – the smallest geography used by the Office for National Statistics which equates to around 1,500 people or 650 households) in the city. These values are considered alongside environmental data such as air quality measurements and urban heat island (UHI) projections from The University of Birmingham, as well as the Indices of Multiple Deprivation, a measurement of relative deprivation. Flood risk data, including percentage of impervious surfaces calculated from Ordnance Survey mapping, and stormwater reduction values, can also be factored in.
The LSOA geography is also used for the platforms ‘Grow’ functionality which takes the National Tree Map canopy cover and applies either a target value or a target increase, with the mortality rate of new planting and the size of trees at maturity, to calculate the number of trees to reach the desired goal.
Ralph Coleman, Chief Commercial Officer, added: “The National Tree Map is a dataset unique to Bluesky and was launched 12 years ago. However, with environmental and carbon reduction projects at the forefront of many agendas for local authorities and other organisations, we are seeing an increase in the use of the National Tree Map to support with projects assessing where current canopy cover is and where an increase is needed, as well as helping analyse carbon capture figures and monitoring of trees close to highways or key public areas like schools or play areas. It is a tool that can be accessed quickly and means a lot of work can be done simply from a desktop, removing the need for resource-heavy site visits.”
Awarded the United Nations Tree City of the World three years in a row, Birmingham City Council was the first Local Authority in the UK to publish an Urban Forest Master Plan (UFMP) in 2021. With the vision of ‘… more trees, that deliver benefits for health, nature, and climate change, for all communities, now and in the future, as part of an inclusive and sustainable urban forest’, the UFMP contains targets for canopy cover, age and species diversity, and looks at both public and private owned trees and those that are managed as individual trees as well as those that form groups in woodlands and other natural areas.
The National Tree Map is created using innovative algorithms and image processing techniques, from the most up-to-date aerial photography and terrain data for the whole of Great Britain and Ireland. It provides a detailed reference as to the location, canopy cover and height of trees 3m and taller which can be applied alongside other data to establish ownership, proximity to other features or assets, and relationships between demographic, economic or social data.
National Tree Map data is widely used by a number of different market sectors, for example local authorities, energy companies, property developers and academic and research organisations, investigating the role of trees and green spaces and their impact on health, environment and infrastructure.


